
Journal of Geodesy and Geoinformation Science ›› 2022, Vol. 5 ›› Issue (2): 19-28.doi: 10.11947/j.JGGS.2022.0203
• Special Issue • Previous Articles Next Articles
Zhuo LIU1( ),Hui LIN1,2(),Qinghua HE1,2,Yuling WANG1
Received:2021-10-11
Accepted:2022-01-02
Online:2022-06-20
Published:2022-07-22
Contact:
Hui LIN
E-mail:lz1129@jxnu.edu.cn;huihin@cuhk.edu.hk
About author:Zhuo LIU(1996—), male, majors in criminal geography, spatial integrated humanities and social science research. E-mail: Supported by:Zhuo LIU,Hui LIN,Qinghua HE,Yuling WANG. Temporal-spatial Distribution of Various Types of Crime in the Special Wards of Tokyo[J]. Journal of Geodesy and Geoinformation Science, 2022, 5(2): 19-28.
Add to citation manager EndNote|Reference Manager|ProCite|BibTeX|RefWorks

Fig.1
Map of study area.(Tokyo)"

Tab.1
The statistical description of crime data"
| First classification | Second classification | Total number | Highest value area | |
|---|---|---|---|---|
| Vicious crime | Murder, wounding, rape | 523 | Shinjuku | |
| Violent crime | Atrocity | 3518 | Shinjuku | |
| hurt | 2123 | Shinjuku | ||
| Burglary | Burglary | 2740 | Nerima | |
| Non-housebreaking crime | Bicycle theft | 23726 | Shinjuku | |
| Motorcycle theft | 664 | Adachi | ||
| Car theft | 1729 | Edogawa | ||
| Bag thief | 1208 | Shinjuku | ||
| Pick pocketing | 1365 | Shibuya | ||
| Petty theft | 9615 | Shibuya | ||
| Other types of theft | 13235 | Shinjuku | ||
| Other types of property crime | Illegal possession | 2036 | Shinjuku | |
| Fraud | 4415 | Chiyoda | ||
| Intellectual crime | 418 | Shinjuku | ||
| Other criminal offenses | 9263 | Chiyoda |

Fig.2
Monthly distribution of SCII for each crime type"
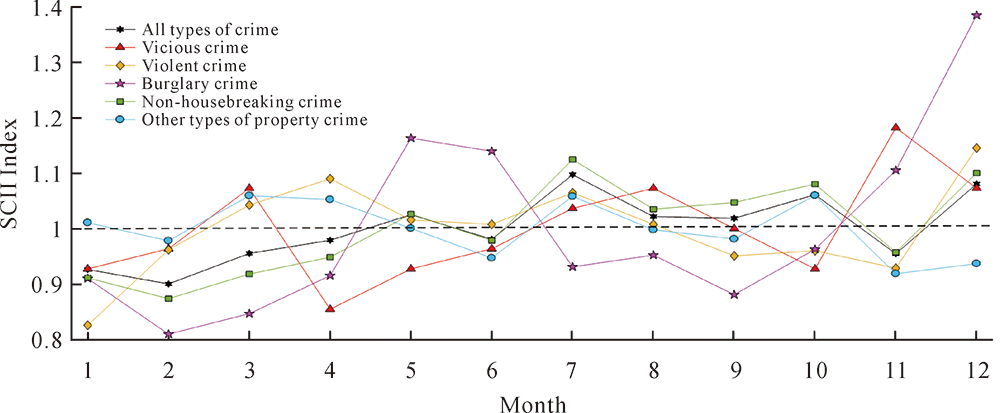

Fig.3
The hourly distribution of SCII of each type of crime"
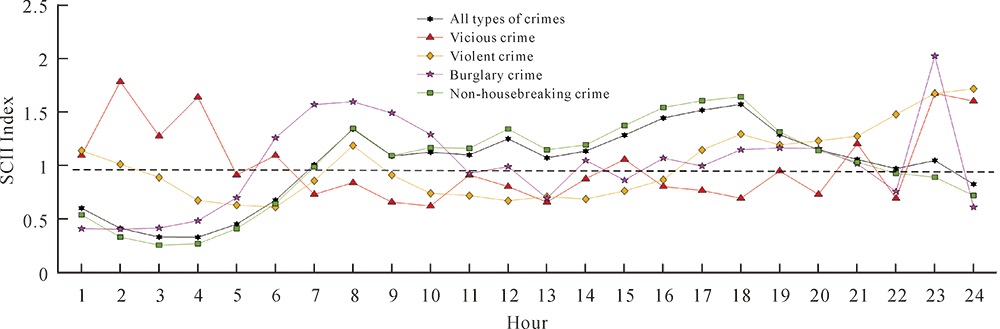
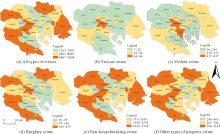
Fig.4
Spatial distribution of the number of crimes in the Special wards of Tokyo"

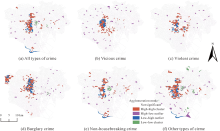
Fig. 5
Spatial agglomeration of various types of crime in the Special wards of Tokyo"
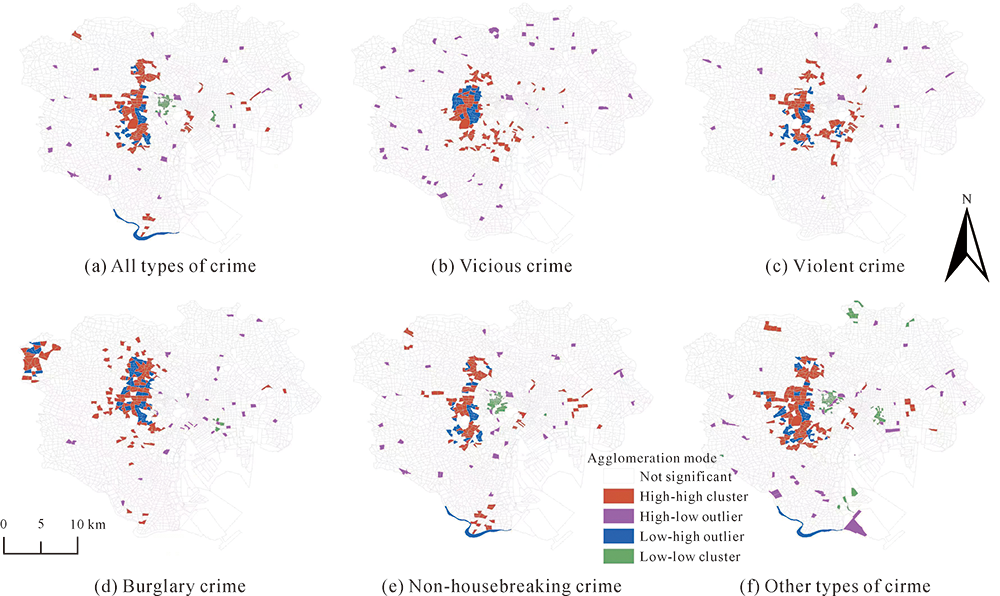
Tab.2
Global Moran’s I index for various types of crime in the special wards of Tokyo in 2019"
| Category | Moran’s I | Z score | P-value |
|---|---|---|---|
| All types of crime | 0.246 | 23.57 | 0.001*** |
| Vicious crime | 0.175 | 17.79 | 0.001*** |
| Violent crime | 0.232 | 23.63 | 0.001*** |
| Burglary crime | 0.124 | 12.60 | 0.001*** |
| Non-housebreaking crime | 0.272 | 27.51 | 0.001*** |
| Other types of property crime | 0.287 | 28.82 | 0.001*** |
| [1] |
SAVAGE J, KANAZAWA S. Social capital, crime, and human nature[J]. Journal of Contemporary Criminal Justice, 2002, 18(2): 188-211.
doi: 10.1177/1043986202018002005 |
| [2] | ZHU Xiaoguang. Study on criminal geography[J]. Human Geography, 1989(2): 40-46. |
| [3] | SUN Fenghua, MAO Aihua. Study on the theories of criminal geography[J]. Human Geography, 2003, 18(5): 70-74. |
| [4] |
GRUBESIC T H, MACK E A. Spatio-temporal interaction of urban crime[J]. Journal of Quantitative Criminology, 2008, 24(3): 285-306.
doi: 10.1007/s10940-008-9047-5 |
| [5] |
LU Juan, TANG Guoan, ZHANG Hong, et al. A review of research methods for spatiotemporal distribution of the crime hot spots[J]. Progress in Geography, 2012, 31(4): 419-425.
doi: 10.11820/dlkxjz.2012.04.004 |
| [6] |
JIANG Chao, TANG Huanli, LIU Lin. Review of crime geography in China[J]. Progress in Geography, 2014, 33(4): 561-573.
doi: 10.11820/dlkxjz.2014.04.013 |
| [7] | MEI Jianming. On the origin, development and contribution of environmental criminology[J]. Journal of Chinese People’s Public Security University (Social Sciences Edition), 2006, 22(5): 66-72. |
| [8] |
LI Gang, TAN Ran, WANG Huijuan, et al. Geographic characteristics of child trafficking crime in China[J]. Scientia Geographica Sinica, 2017, 37(7): 1049-1058.
doi: 10.13249/j.cnki.sgs.2017.07.010 |
| [9] | LI Gang, YAN Xiang, WANG Huijuan. The basic features and control measures of trafficking in children in China[J]. Internal Contributions of Chinese Social Science, 2015(5): 65-79. |
| [10] |
XU Chong, LIU Lin, ZHOU Suhong. Patterns of near-repeat street robbery in DP peninsula[J]. Geographical Research, 2015, 34(2): 384-394.
doi: 10.11821/dlyj201502017 |
| [11] | XU Jiaxiang, CHEN Peng, CHEN Jianguo. Research on spatial-temporal distributions of burglary based on the environ mental criminology: based on the analysis of crime in Beijing[J]. Human Geography, 2018, 33(1): 43-50. |
| [12] |
LIU Lin, JIANG Chao, ZHOU Suhong, et al. Spatial-temporal patterns of burglary at multiple scales: the case of DP Peninsula in H City, China[J]. Geographical Research, 2017, 36(12): 2451-2464.
doi: 10.11821/dlyj201712015 |
| [13] |
LIU Yimeng, LI Weihong, WANG Xin. Spatiotemporal distribution of drug crimes at micro-scale: taking NH and DM residential communities in SZ City as an example[J]. Progress in Geography, 2020, 39(5): 841-852.
doi: 10.18306/dlkxjz.2020.05.012 |
| [14] | YU Yang, ZHU Mengyu, XI Jingyi, et al. The temporal and spatial distribution of urban juvenile property crimes and preventive measures between China and American[J]. Juvenile Delinquency Prevention Research, 2020(5): 54-61. |
| [15] | XIE Jianshe, LIU Nian, XIE Yu. Time and space analysis of juvenile delinquency—an investigation from the juvenile correctional institution in Guangdong Province[J]. Chinese Journal of Population Science, 2014(3): 115-125. |
| [16] | XU Meiting. Research on the prevention and management of the crimes committed by the elderly in Japan[D]. Ji’nan: Shandong University, 2020. |
| [17] | CONG Mei. Analysis of hot issues of urban crime in the new era[J]. Journal of Henan Police College, 2019, 28(5): 29-37. |
| [18] | YUAN Penghui. Study on the regional characteristics and crime behavior patterns of criminals—a practical study on burglary in Beijing from 2005 to 2014[D]. Beijing: People’s Public Security University of China, 200. |
| [19] | WU Xingjie. An empirical study on income inequality of China’s floating population and criminal rate[D]. Hangzhou: Zhejiang University, 2010. |
| [20] | SHEN Yukun, LUO Huasong, HONG Juhua, et al. Study on spatio-temporal evolution of terrorist attacks in South America[J]. World Regional Studies, 2021, 30(1): 12-24. |
| [21] | LIU Ziyi. Research on temporal and spatial characteristics of terrorist organizations and their activities[D]. Zhengzhou: Information Engineering University, 2017. |
| [22] |
YAN Xiaobing. Spatio-temporal pattern of crime rates in China[J]. Scientia Geographica Sinica, 2013, 33(5): 529-537.
doi: 10.13249/j.cnki.sgs.2013.05.529 |
| [23] | CHEN Man, WU Shuwen, YAN Jiaqi, et al. 2014 to 2015 in Hangzhou burglary crime temporal and spatial distribution analysis[J]. Geospatial Information, 2017, 15(12): 63-66, 75. |
| [24] |
XIANG Jinqiao, GAO Chundong, MA Tian, et al. Spatial-temporal distribution characteristics of cyber fraud in China on county scale[J]. Scientia Geographica Sinica, 2021, 41(6): 1079-1087.
doi: 10.13249/j.cnki.sgs.2021.06.017 |
| [25] |
XU Chong, LIU Lin, ZHOU Suhong, et al. The spatio-temporal patterns of street robbery in DP Peninsula[J]. Acta Geographica Sinica, 2013, 68(12): 1714-1723.
doi: 10.11821/dlxb201312011 |
| [26] | XIAO Hongyuan. Analysis on the factors and mechanism affecting the security of urban community residents based on place: a case of Jinghua south road community in Chengdu City[D]. Xi’an: Xi’an International Studies University, 2017. |
| [27] | ZENG Minling, MO Wenbin, LI Jiahao, et al. Geospatial analysis of students’ perception and fear of crime in university campus: a case study of four campus in Xiangzhou District, Zhuhai[J]. Human Geography, 2018, 33(1): 51-60. |
| [28] |
LIU Daqian, SONG Wei, XIU Chunliang. Spatial analysis on robbery, forcible seizure, vehicle theft and burglary in Changchun[J]. Scientia Geographica Sinica, 2014, 34(11): 1344-1352.
doi: 10.13249/j.cnki.sgs.2014.011.1344 |
| [29] | LIU Lin, DU Fangye, SONG Guangwen, et al. Detecting and characterizing symbiotic clusters of crime[J]. Geographical Research, 2018, 38(8): 1199-1209. |
| [30] | FENG Jian, HUANG Linshan, DONG Ying, et al. Research on the spatial-temporal characteristics and mechanism of urban crime: a case study of property crime in Beijing[J]. Acta Geographica Sinica, 2012, 67(12): 1645-1656. |
| [31] | LIU Daqian, XIU Chunliang, SONG Wei. Research on classification of crimes in Changchun using factor analysis[J]. Human Geography, 2015, 30(5): 38-42, 64. |
| [32] | SONG Erdong. Analysis of classification and evaluation of criminal crimes[J]. Public Security Research, 2003(2): 22-26. |
| [33] | QU Biweishi, ZHAO Zhenbin, DENG Yuanjie, et al. Study on the multi-scale temporal and spatial pattern of “two robberies and one theft” crime in the main urban area of Chengdu[J]. Journal of Zhejiang University (Science Edition), 2019, 46(6): 745-754. |
| [34] | LIU Zhong, LI Yuxiang, ZHAO Xinyi. The analysis of prevent and controlable countermeasures of “Crime Before the Festival”[J]. Journal of Hunan Police Academy, 2018, 30(6): 63-67. |
| [35] | LI Gang. On the current situation and prevention of serious violent crimes[J]. Legal System and Society, 2010(26): 267-268, 270. |
| [36] |
DE MELO S N, PEREIRA D V S, ANDRESEN M A, et al. Spatial/temporal variations of crime: a routine activity theory perspective[J]. International Journal of Offender Therapy and Comparative Criminology, 2018, 62(7): 1967-1991.
doi: 10.1177/0306624X17703654 |
| [37] | YANG Ling. Chicago school’s crime theory[J]. Chinese Criminology Review, 2016(1): 106-112. |
| [1] | Kun QIN,Hui LIN,Yang YUE,Feng ZHANG,Jianya GONG. Spatial Humanities and Geo-computation for Social Sciences:Advances and Applications [J]. Journal of Geodesy and Geoinformation Science, 2022, 5(2): 1-6. |
| [2] | Yuyun LIANG,Yao YAO,Xiaoqin YAN,Qingfeng GUAN. Estimating the Spatial Variation of Electricity Consumption Anomalies and the Influencing Factors [J]. Journal of Geodesy and Geoinformation Science, 2022, 5(2): 29-37. |
| [3] | Qixin WANG,Kun QIN,Donghai LIU,Gang XU,Yanqing XU,Yang ZHOU,Rui XIAO. Spatial Interaction Network Analysis of Crude Oil Trade Relations between Countries along the Belt and Road [J]. Journal of Geodesy and Geoinformation Science, 2022, 5(2): 60-74. |
| [4] | Xuchen JIANG,Meng WANG,Gang XU,Bingwang FANG,Kun QIN,Rui XIAO. Urban Development Boundary Simulation Based on “Double Evaluation” and FLUS Model [J]. Journal of Geodesy and Geoinformation Science, 2022, 5(2): 7-18. |
| [5] | An HUAI,Xueying ZHANG,Weicheng AI,Tianyang CAO. Spatial-temporal Analysis of Emotions in Society in News [J]. Journal of Geodesy and Geoinformation Science, 2022, 5(2): 98-110. |
| [6] | Yufang HE,Wu ZHU,Yang LEI,Qin ZHANG,Zhenhong LI. A Comparative Study of Ionospheric Correction on SAR Interferometry—A Case Study of L’Aquila Earthquake [J]. Journal of Geodesy and Geoinformation Science, 2022, 5(1): 5-13. |
| [7] | Zhaohui XUE,Xiangyu NIE. Low-Rank and Sparse Representation with Adaptive Neighborhood Regularization for Hyperspectral Image Classification [J]. Journal of Geodesy and Geoinformation Science, 2022, 5(1): 73-90. |
| [8] | Yibin YAO,Yuanxi YANG,Heping SUN,Jiancheng LI. Geodesy Discipline: Progress and Perspective [J]. Journal of Geodesy and Geoinformation Science, 2021, 4(4): 1-10. |
| [9] | Xinchang ZHANG,Shaoying LI,Qiming ZHOU,Ying SUN. Logical and Innovative Construction of Digital Twin City [J]. Journal of Geodesy and Geoinformation Science, 2021, 4(4): 113-120. |
| [10] | Jiaqi YAO,Guoyuan LI,Jiyi CHEN,Genghua HUANG,Xiongdan YANG,Shuaitai ZHANG. Cloud Detection and Centroid Extraction of Laser Footprint Image of GF-7 Satellite Laser Altimetry [J]. Journal of Geodesy and Geoinformation Science, 2021, 4(3): 1-12. |
| [11] | Zhilin LI,Peichao GAO,Zhu XU. Information Theory of Cartography: An Information-theoretic Framework for Cartographic Communication [J]. Journal of Geodesy and Geoinformation Science, 2021, 4(1): 1-16. |
| [12] | Valeria CORCIONE,Ferdinando NUNZIATA,Marcos PORTABELLA,Giuseppe GRIECO,Xiaofeng YANG,Maurizio MIGLIACCIO. SAR Azimuth Cut-off to Estimate Wind Speed under High Wind Regimes [J]. Journal of Geodesy and Geoinformation Science, 2021, 4(1): 30-37. |
| [13] | Xiaoming LI,Susanne LEHNER. Observation of Offshore Wind Farm Wakes by Spaceborne Synthetic Aperture Radar [J]. Journal of Geodesy and Geoinformation Science, 2021, 4(1): 38-48. |
| [14] | Kunpeng XU,Lei ZHAO,Kun LI,Erxue CHEN,Wangfei ZHANG,Hao YANG. Estimation of Crop Biomass Using GF-3 Polarization SAR Data Based on Genetic Algorithm Feature Selection [J]. Journal of Geodesy and Geoinformation Science, 2020, 3(4): 126-136. |
| [15] | Gabriel Del BARRIO,Zhihai GAO,Jaime Martinez-VALDERRAMA,Xiaosong LI,Maria E. SANJUAN,Bin SUN,Alberto RUIZ,Bengyu WANG,Juan PUIGDEFABREGAS. Comparing Land Degradation and Regeneration Trends in China Drylands [J]. Journal of Geodesy and Geoinformation Science, 2020, 3(4): 89-97. |
| Viewed | ||||||
|
Full text |
|
|||||
|
Abstract |
|
|||||