
Journal of Geodesy and Geoinformation Science ›› 2024, Vol. 7 ›› Issue (1): 3-15.doi: 10.11947/j.JGGS.2024.0102
Previous Articles Next Articles
ZUO Chenyu1,2( ), XU Yifan2, DING Linfang3, MENG Liqiu2
Published:2024-03-25
Online:2024-03-20
About author:ZUO Chenyu E-mail: chenyu.zuo@csfm.ethz.ch
ZUO Chenyu, XU Yifan, DING Linfang, MENG Liqiu. ST-Map: an Interactive Map for Discovering Spatial and Temporal Patterns in Bibliographic Data[J]. Journal of Geodesy and Geoinformation Science, 2024, 7(1): 3-15.
Add to citation manager EndNote|Reference Manager|ProCite|BibTeX|RefWorks
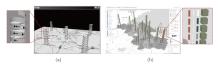
Figure 1
The spiral representation[46] and the cubic representation[47] in STC"
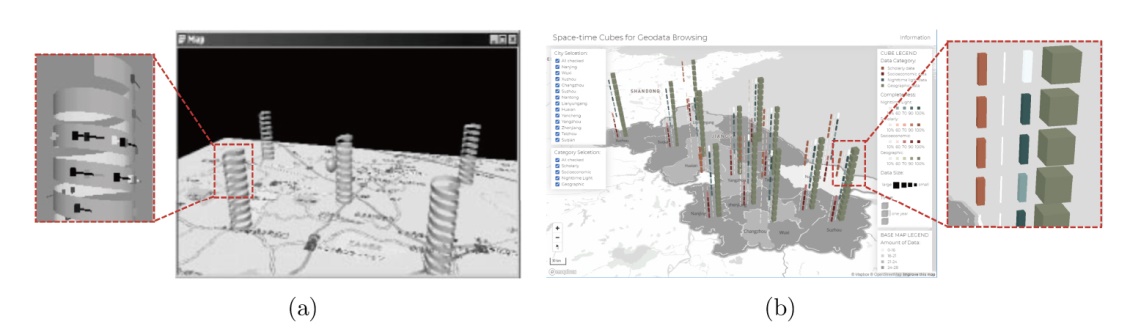
Table 1
An example of metadata of an article"
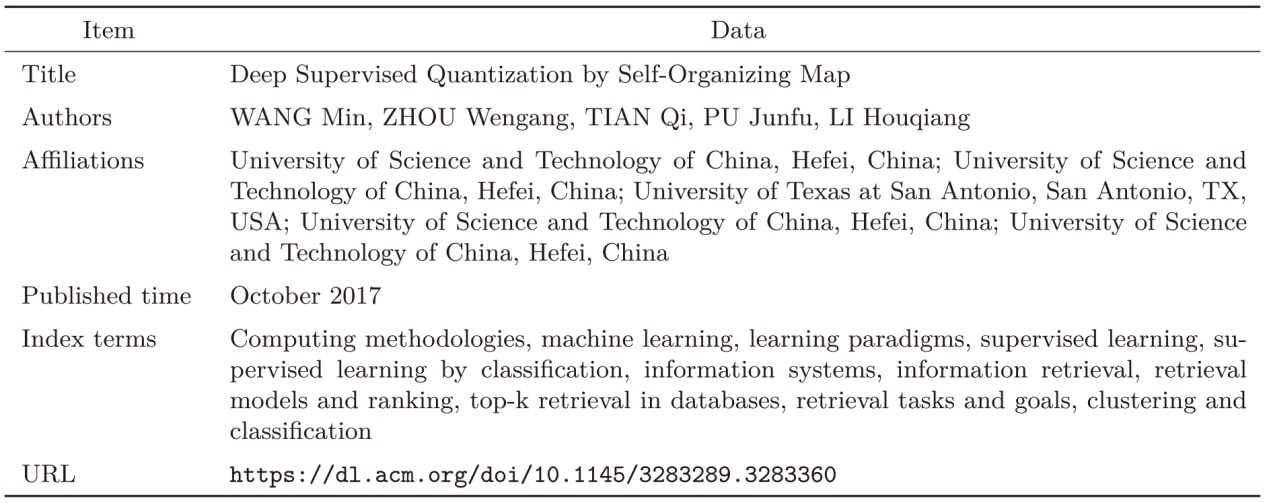 |
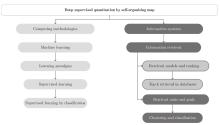
Figure 2
An example of the poly-hierarchical structure of the example article in Tab. 1"
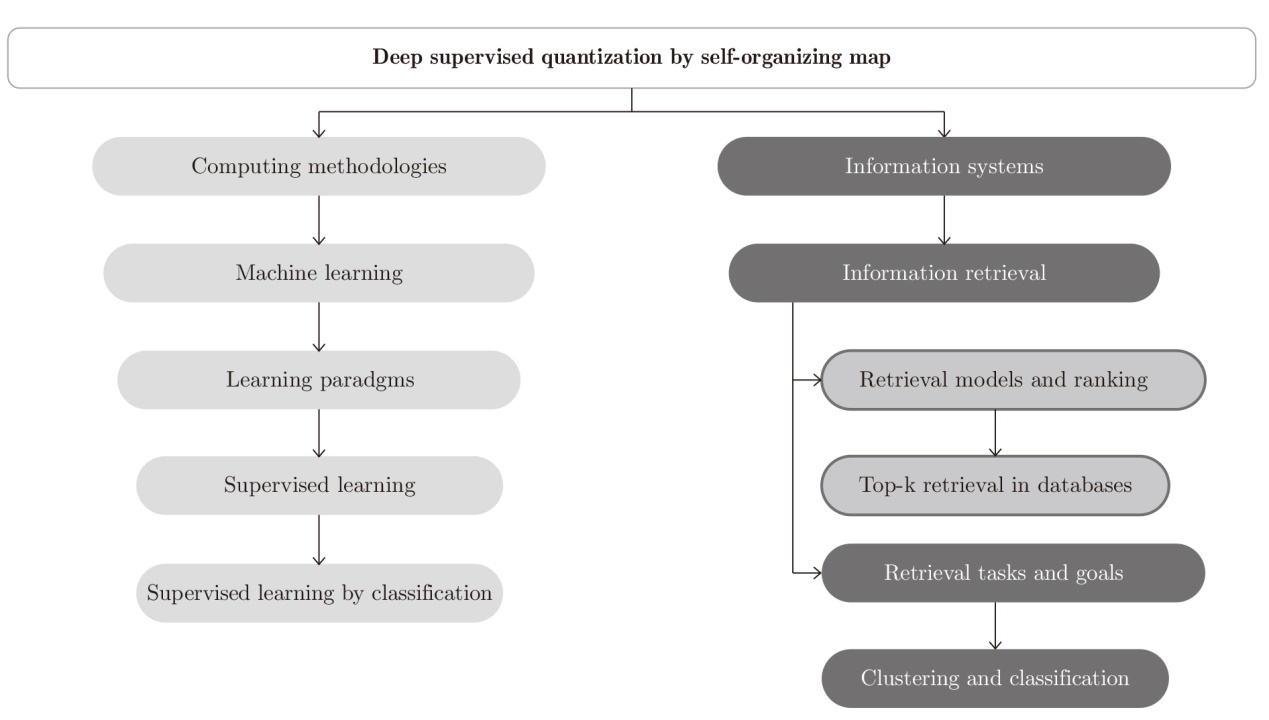

Figure 3
A three-dimensional symbol from a top view and the legend of categories"
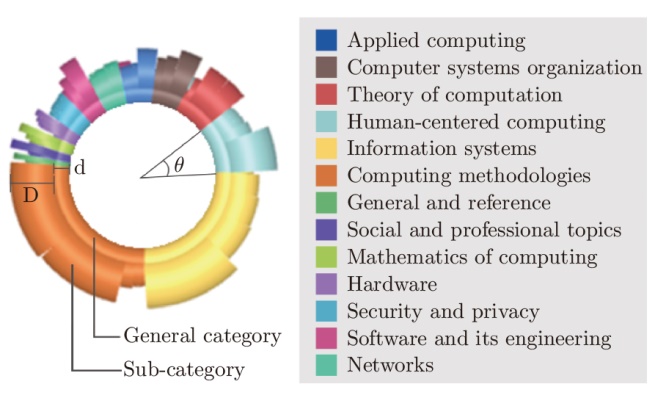

Figure 4
A design of space-time cube symbols to show the temporal patterns from a bird view, horizontal view, and top view"
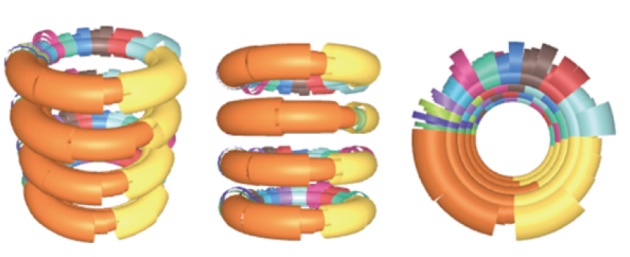
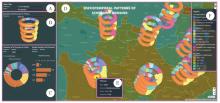
Figure 5
The visual interface of ST-Map with multiple interactive and interlinked panels"
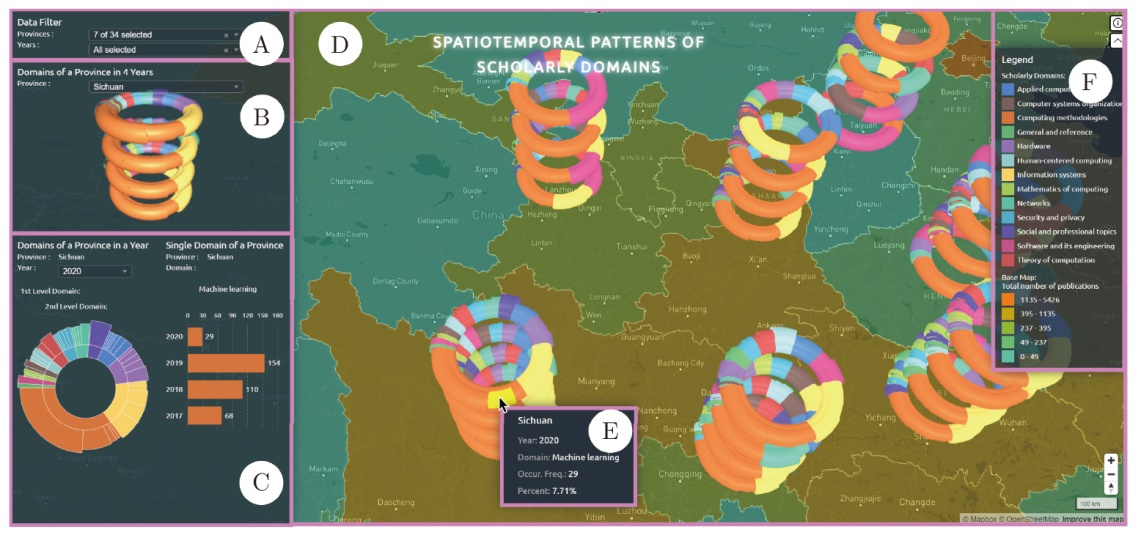
Table 2
The four statements and operations on the interface"
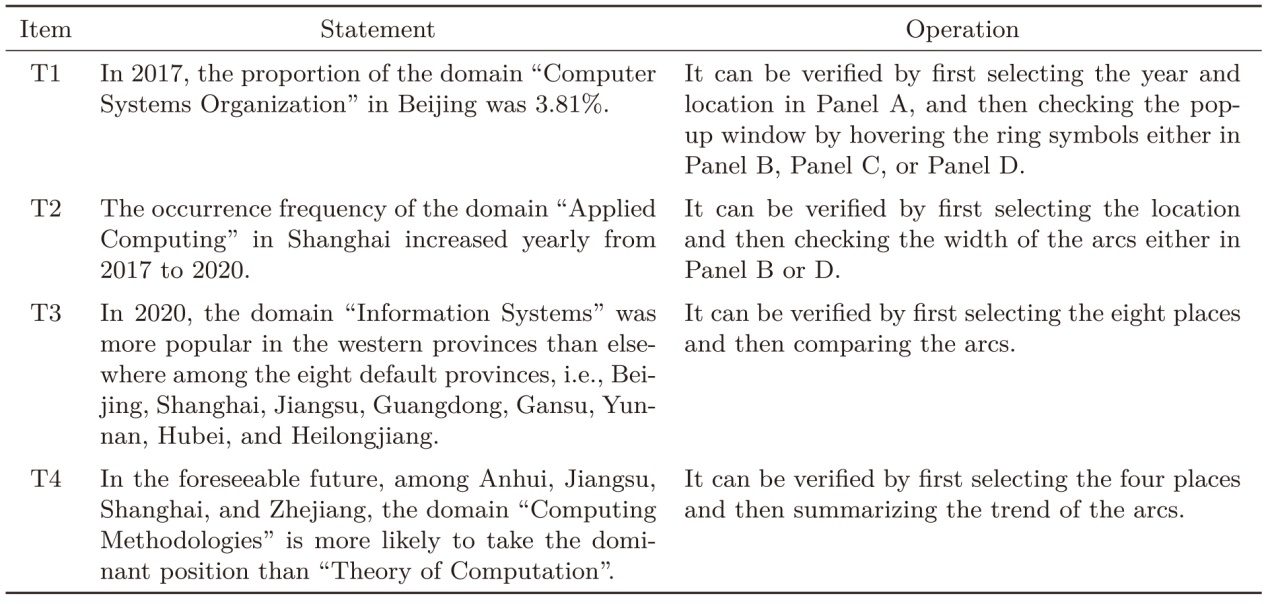 |
Table 3
The metrics of understandability (U1-U4) and engagement (E1-E4)"
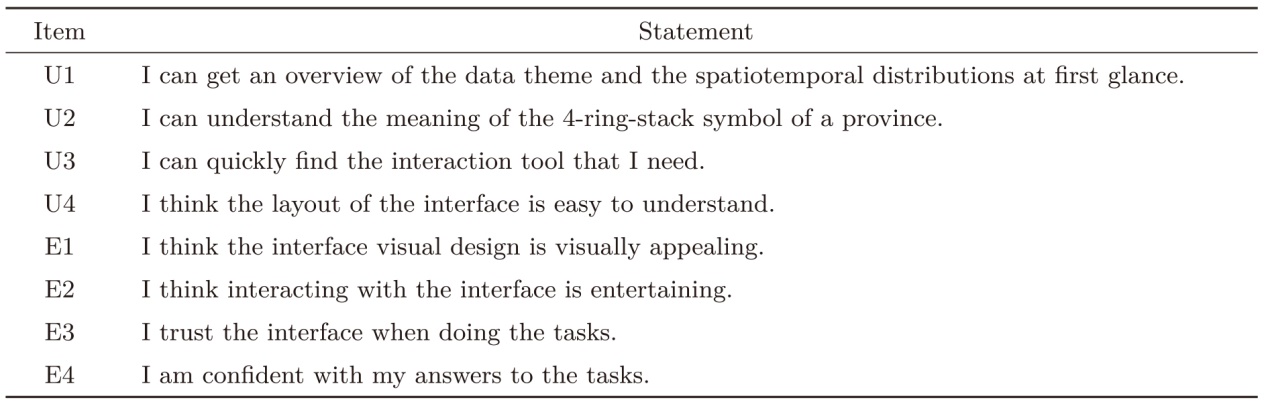 |
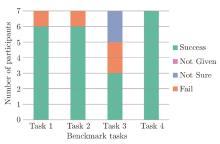
Figure 6
The success rate of the benchmark tasks"

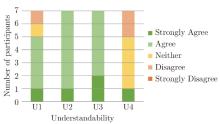
Figure 7
The results of the user understandability"

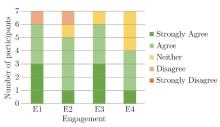
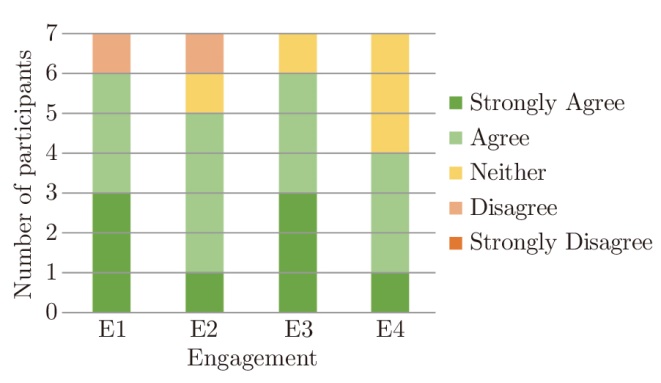
Figure 8
The results of the engagement"
| [1] | GROSSMAN G M, HELPMAN E. Trade, knowledge spillovers, and growth[J]. European Economic Review, 1991, 35(2-3): 517-526. |
| [2] | DÖRING T, SCHNELLENBACH J. What do we know about geographical knowledge spillovers and regional growth: A survey of the literature[J]. Regional Studies, 2006, 40(3): 375-395. |
| [3] | CSOMÓS G. On the challenges ahead of spatial scientometrics focusing on the city level[J]. Aslib Journal of Information Management, 2020, 72(1): 67-87. |
| [4] | CSOMÓS G, VIDA Z V, LENGYEL B. Exploring the changing geographical pattern of international scientific collaborations through the prism of cities[J]. PLoS One, 2020, 15(11): e0242468. |
| [5] | BORT S, OEHME M, ZOCK F. Regional networks, alliance portfolio configuration, and innovation performance[M]// Understanding the Relationship Between Networks and Technology, Creativity and Innovation. Leeds: Emerald Group Publishing Limited, 2014: 229-256. |
| [6] | ORLANDO M, VERBA M, WEILER S. Universities, agglomeration, and regional innovation[J]. Review of Regional Studies, 2019, 49(3): 407-427. |
| [7] | AUTANT-BERNARD C, LESAGE J P. Quantifying knowledge spillovers using spatial econometric models[J]. Journal of Regional Science, 2011, 51(3): 471-496. DOI: 10.1111/j.1467-9787.2010.00705.x. |
| [8] | HOLL A, PETERS B, RAMMER C. Local knowledge spillovers and innovation persistence of firms[J]. Economics of Innovation and New Technology, 2023, 32(6): 826-850. DOI: 10.1080/10438599.2022.2036609. |
| [9] | BUZARD K, CARLINO G A, HUNT R M, et al. Localized knowledge spillovers: evidence from the spatial clustering of R&D labs and patent citations[J]. Regional Science and Urban Economics, 2020, 81: 103490. |
| [10] | TIBERIUS V, SCHWARZER H, ROIG-DOBÓN S. Radical innovations: between established knowledge and future research opportunities[J]. Journal of Innovation & Knowledge, 2021, 6(3): 145-153. |
| [11] | CANCINO C A, MERIGÓ J M, CORONADO F C. A bibliometric analysis of leading universities in innovation research[J]. Journal of Innovation & Knowledge, 2017, 2(3): 106-124. |
| [12] | J-FIGUEIREDO R, NETO J V, QUELHAS O L G, et al. Knowledge Intensive Business Services (KIBS): bibliometric analysis and their different behaviors in the scientific literature: topic 16-innovation and services[J]. RAI Revista de Administração e Inovação, 2017, 14(3): 216-225. |
| [13] | NASCIMENTO R F, ÁVILA M F, TARANTO O P, et al. Agglomeration in fluidized bed: bibliometric analysis, a review, and future perspectives[J]. Powder Technology, 2022, 406: 117597. |
| [14] | KLEMINSKI R, KAZIENKO P, KAJDANOWICZ T. Analysis of direct citation, co-citation and bibliographic coupling in scientific topic identification[J]. Journal of Information Science, 2022, 48(3): 349-373. DOI: 10.1177/0165551520962775. |
| [15] | KEMENY T, STORPER M. Is specialization good for regional economic development?[J]. Regional Studies, 2015, 49(6): 1003-1018. |
| [16] | BOTTAZZI G, GRAGNOLATI U. Cities and clusters: economy-wide and sector-specific effects in corporate location[J]. Regional Studies, 2015, 49(1): 113-129. |
| [17] | BUENSTORF G, FRITSCH M, MEDRANO L F. Regional knowledge, organizational capabilities and the emergence of the west German laser systems industry, 1975—2005[J]. Regional Studies, 2015, 49(1): 59-75. |
| [18] | GUI Qinchang, DU Debin, LIU Chengliang. The changing geography of scientific knowledge production: evidence from the metropolitan area level[J]. Applied Spatial Analysis and Policy, 2023, 17(1): 157-174. |
| [19] | SUN Huaping, EDZIAH B K, KPORSU A K, et al. Energy efficiency: the role of technological innovation and knowledge spillover[J]. Technological Forecasting and Social Change, 2021, 167: 120659. |
| [20] | ZHAO Yang, WANG Lin, ZHANG Yaming. Research thematic and emerging trends of contextual cues: a bibliometrics and visualization approach[J]. Library Hi Tech, 2021, 39(2): 462-487. |
| [21] | NINKOV A, FRANK J R, MAGGIO L A. Bibliometrics: Methods for studying academic publishing[J]. Perspectives on Medical Education, 2022, 11(3): 173-176. |
| [22] | DONTHU N, KUMAR S, MUKHERJEE D, et al. How to conduct a bibliometric analysis: an overview and guidelines[J]. Journal of business research, 2021, 133: 285-296. |
| [23] | MOLONTAY R, NAGY M. Twenty years of network science: a bibliographic and co-authorship network analysis[M]//ÇAKIRTAŞ M, OZDEMIR M K. Big Data and Social Media Analytics: Trending Applications. Cham: Springer, 2021: 1-24. DOI: 10.1007/978-3-030-67044-3_1. |
| [24] |
HEVEY D. Network analysis: a brief overview and tutorial[J]. Health Psychology and Behavioral Medicine, 2018, 6(1): 301-328. DOI: 10.1080/21642850.2018.1521283.
pmid: 34040834 |
| [25] | LOZANO S, CALZADA-INFANTE L, ADENSO-DÍAZ B, et al. Complex network analysis of keywords co-occurrence in the recent efficiency analysis literature[J]. Scientometrics, 2019, 120(2): 609-629. |
| [26] | LIM W M, KUMAR S. Guidelines for interpreting the results of bibliometric analysis: a sensemaking approach[J]. Global Business and Organizational Excellence, 2024, 43(2): 17-26. |
| [27] | ZHUANG Liang, YE Chao, LIESKE S N. Intertwining globality and locality: bibliometric analysis based on the top geography annual conferences in America and China[J]. Scientometrics, 2020, 122(2): 1075-1096. |
| [28] | IBÁÑEZ J J, BREVIK E C, CERDÀ A. Geodiversity and geoheritage: detecting scientific and geographic biases and gaps through a bibliometric study[J]. Science of The Total Environment, 2019, 659: 1032-1044. |
| [29] | KRAKER P, SCHRAMM M, KITTEL C, et al. Openknowledgemaps/Headstart: Headstart 7[EB/OL]. (2021-11-25)[2024-01-02]. https://doi.org/10.5281/zenodo.5726914. |
| [30] | CHEN Chaomei, SONG Min. Visualizing a field of research: A methodology of systematic scientometric reviews[J]. PLoS One, 14(10): e0223994. DOI: 10.1371/journal.pone.0223994. |
| [31] | CHEN Chaomei. Citespace II: detecting and visualizing emerging trends and transient patterns in scientific literature[J]. Journal of the American Society for Information Science and Technology, 2006, 57(3): 359-377. |
| [32] | SEBASTIAN Y, SIEW E G, ORIMAYE S O. Emerging approaches in literature-based discovery: techniques and performance review[J]. The Knowledge Engineering Review, 2017, 32: e12. |
| [33] | ZUO Chenyu, DING Linfang, YANG Zhuo, et al. Multiscale geovisual analysis of knowledge innovation patterns using big scholarly data[J]. Annals of GIS, 2022, 28(2): 197-212. |
| [34] | AIGNER W, MIKSCH S, SCHUMANN H, et al. Guiding the selection of visualization techniques[M]//AIGNER W, MIKSCH S, SCHUMANN H, et al. Visualization of Time-Oriented Data. London: Springer, 2023: 193-210. DOI: 10.1007/978-1-4471-7527-8_7. |
| [35] | MCNABB L, LARAMEE R S. Multivariate maps—a glyph-placement algorithm to support multivariate geospatial visualization[J]. Information, 2019, 10(10): 302. |
| [36] | WEI Zhonghui, GU Xiaohe, SUN Qian, et al. Analysis of the spatial and temporal pattern of changes in abandoned farmland based on long time series of remote sensing data[J]. Remote Sensing, 2021, 13(13): 2549. |
| [37] | ZHU Yingzhen, YU Jifang, WU Jiangqin. Chro-Ring: a time-oriented visual approach to represent writer's history[J]. The Visual Computer, 2016, 32(9): 1133-1149. |
| [38] | ANDRIENKO G, ANDRIENKO N, SCHUMANN H, et al. Visualization of trajectory attributes in space-time cube and trajectory wall[M]//BUCHROITHNER M, PRECHTEL N, BURGHARDT D. Cartography from Pole to Pole. Berlin, Heidelberg: Springer, 2014: 157-163. DOI: 10.1007/978-3-642-32618-9_11. |
| [39] | BU Chuan, ZHANG Quanjie, WANG Qianwen, et al. Sinestream: improving the readability of streamgraphs by minimizing sine illusion effects[J]. IEEE Transactions on Visualization and Computer Graphics, 2021, 27(2): 1634-1643. |
| [40] | GRIFFIN A L, MACEACHREN A M, HARDISTY F, et al. A comparison of animated maps with static small-multiple maps for visually identifying space-time clusters[J]. Annals of the Association of American Geographers, 2006, 96(4): 740-753. DOI: 10.1111/j.1467-8306.2006.00514.x. |
| [41] | BOYANDIN I, BERTINI E, LALANNE D. A qualitative study on the exploration of temporal changes in flow maps with animation and small-multiples[J]. Computer Graphics Forum, 2012, 31(3pt2): 1005-1014. DOI: 10.1111/j.1467-8659.2012.03093.x. |
| [42] |
KRISTENSSON P O, DAHLBACK N, ANUNDI D, et al. An evaluation of space time cube representation of spatiotemporal patterns[J]. IEEE Transactions on Visualization and Computer Graphics, 2009, 15(4): 696-702.
doi: 10.1109/TVCG.2008.194 pmid: 19423892 |
| [43] | HÄGERSTRAAND T. What about people in regional science?[J]. Papers in Regional Science, 1970, 24(1): 7-21. |
| [44] | ANDRIENKO N, ANDRIENKO G, RINZIVILLO S. Exploiting spatial abstraction in predictive analytics of vehicle traffic[J]. ISPRS International Journal of Geo-Information, 2015, 4(2): 591-606. |
| [45] | PETERS S, BETZ H D, MENG Liqiu. Visual analysis of lightning data using space-time-cube[M]//BUCHROITHNER M, PRECHTEL N, BURGHARDT D. Cartography from Pole to Pole. Berlin, Heidelberg: Springer, 2014: 165-176. |
| [46] | HEWAGAMAGE K P, HIRAKAWA M, ICHIKAWA T. Interactive visualization of spatiotemporal patterns using spirals on a geographical map[C]// Proceedings of 1999 IEEE Symposium on Visual Languages. Tokyo, Japan: IEEE, 1999: 296-303. |
| [47] | ZUO Chenyu, GAO Mengyao, DING Linfang, et al. Space-time cube for visual queries over metadata of heterogeneous geodata[J]. KN-Journal of Cartography and Geographic Information, 2022, 72(1): 29-39. |
| [1] | Kun QIN,Hui LIN,Yang YUE,Feng ZHANG,Jianya GONG. Spatial Humanities and Geo-computation for Social Sciences:Advances and Applications [J]. Journal of Geodesy and Geoinformation Science, 2022, 5(2): 1-6. |
| Viewed | ||||||
|
Full text |
|
|||||
|
Abstract |
|
|||||